Using dfSplat to identify object leaks: Difference between revisions
| (6 intermediate revisions by the same user not shown) | |||
| Line 1: | Line 1: | ||
=== Preface === | === Preface === | ||
One of the problems when developing a program which has a lot of dynamic objects is that you make sure that all the objects that | One of the problems when developing a program which has a lot of dynamic objects is, that you have to make sure that all the objects that have been created are also destroyed after usage. If you do not remove all of them after usage, then you end up with memory leaks. Memory leaks can be rather unpleasant as they cause problems which are hard to track down. | ||
A couple of areas where you see a lot of usage with dynamic objects is when working with XML and JSON. | A couple of areas where you see a lot of usage with dynamic objects is when working with XML and JSON. | ||
| Line 35: | Line 35: | ||
</source> | </source> | ||
As you can see we are creating | As you can see we are creating 21 objects based on the cObject class and store the object ID's in Objects array. | ||
Then there's some code we are not showing where the objects are used for whatever and finally we destroy the objects. | Then there's some code we are not showing where the objects are used for whatever and finally we destroy the objects. | ||
But.. we only destroy objects with an even object ID, so we are leaking 10 objects on purpose | But.. we only destroy objects with an even object ID, so we are leaking 10 objects here, on purpose in order to display how this technique works. | ||
=== How to run the application in dfSplat === | === How to run the application in dfSplat === | ||
| Line 54: | Line 54: | ||
=== Set the breakpoints === | === Set the breakpoints === | ||
Click back on dfSplat and from the toolbar select "Open Source File", in the "File Open" dialog you get now, navigate to the AppSrc folder of your workspace and select "LeakyObjects.src" and click on the "Open" button. | Click back on dfSplat and from the toolbar select "Open Source File", in the "File Open" dialog you get now, navigate to the AppSrc folder of your workspace and select "LeakyObjects.src" and click on the "Open" button. | ||
[[File:dfSplat-LeakyObjects-Open-Source-File.png]] | |||
The source file now shows in the edit window. | The source file now shows in the edit window. | ||
| Line 62: | Line 64: | ||
Set the breakpoints like this. | Set the breakpoints like this. | ||
[[File:dfSplat-LeakyObjects-Set-Breakpoints.png]] | |||
=== Debug for leaky objects === | === Debug for leaky objects === | ||
Click the Restart Debug button from the toolbar. | Click the Restart Debug button from the toolbar. | ||
[[File:dfSplat-LeakyObjects-Restart-Debug.png]] | |||
Your program will stop at the first breakpoint. | Your program will stop at the first breakpoint. | ||
[[File:dfSplat-LeakyObjects-Stop-at-First-Breakpoint.png]] | |||
Let's have a look at all the objects that are currently in your program. | Let's have a look at all the objects that are currently in your program. | ||
From the Tools menu, select "Object Inspector", you'll see the following dialog: | From the Tools menu, select "Object Inspector", you'll see the following dialog: | ||
[[File:dfSplat-LeakyObjects-Object-Inspector-first-stop.png]] | |||
At this stage we only have a FormFloatingMenu object that is defined somewhere in the Winbase.pkg file that we are pulling in. | At this stage we only have a FormFloatingMenu object that is defined somewhere in the Winbase.pkg file that we are pulling in. | ||
| Line 76: | Line 86: | ||
Close the Object Inspector and run the program (F5) again, we are now at the 2nd breakpoint. Open the Object Inspector again. | Close the Object Inspector and run the program (F5) again, we are now at the 2nd breakpoint. Open the Object Inspector again. | ||
As you can see now, our | [[File:dfSplat-LeakyObjects-Object-Inspector-Second-stop.png]] | ||
As you can see now, our 21 test objects have been created. | |||
So far, not all that exciting. | So far, not all that exciting. | ||
| Line 84: | Line 96: | ||
Re-open the Object Inspector: | Re-open the Object Inspector: | ||
Here you can see WHY the object inspector is an interesting tool to have. | [[File:dfSplat-LeakyObjects-Object-Inspector-Last-Stop.png]] | ||
Here you can see one of the reasons on WHY the object inspector is an interesting tool to have. | |||
The objects that got destroyed are no longer listed, but the ones we "forgot" to destroy are still visible. | The objects that got destroyed are no longer listed, but the ones we "forgot" to destroy are still visible. | ||
| Line 92: | Line 106: | ||
=== Final notes === | === Final notes === | ||
* Beware that you use the Object Inspector and not the Panel Inspector as the latter one is not suitable for this task. The Object Inspector will enumerate ALL objects in your application and | * Beware that you use the Object Inspector and not the Panel Inspector as the latter one is not suitable for this task. The Object Inspector will enumerate ALL objects in your application and tests which of those objects actually exist or not. The Panel Inspector will only query the objects for the current panel and if objects are created dynamically, it won't actually show them! The Panel Inspector was created to give you much faster access to your current view or panel, but it does that at the cost of not enumerating every object (hence why it is faster) | ||
* If you want to test your code to see if it does correctly destroy all the dynamic objects it creates then it is most likely best to create a small temporary program for that. Obviously you can debug your full program, but the object inspector might be very slow to process every single object in your program on opening each time. | * If you want to test your code to see if it does correctly destroy all the dynamic objects it creates then it is most likely best to create a small temporary program for that. Obviously you can debug your full program, but the object inspector might be very slow to process every single object in your program on opening each time. | ||
[[Category: Tutorials]] | [[Category: Tutorials]] | ||
[[Category: Development Tools]] | |||
Latest revision as of 15:06, 24 March 2020
Preface
One of the problems when developing a program which has a lot of dynamic objects is, that you have to make sure that all the objects that have been created are also destroyed after usage. If you do not remove all of them after usage, then you end up with memory leaks. Memory leaks can be rather unpleasant as they cause problems which are hard to track down.
A couple of areas where you see a lot of usage with dynamic objects is when working with XML and JSON.
dfSplat to the rescue as it provides you with a means to track this down.
Our demo program
Here's the program we are going to debug for explaining how this works.
Use Winbase.pkg


Procedure RunMyLeakyCode
  Integer i
  Handle[] Objects

  For i From 0 to 20
    Get CreateNamed (RefClass(cObject)) ("TestObj"+String(i)) to Objects[i]
  Loop
  // Do something here with your objects
  For i From 0 to 20
    If (Mod(i,2)=0) Begin
      Send Destroy of Objects[i]
    End
  Loop
  Send none
End_Procedure


Send RunMyLeakyCode

Input windowindex
As you can see we are creating 21 objects based on the cObject class and store the object ID's in Objects array. Then there's some code we are not showing where the objects are used for whatever and finally we destroy the objects. But.. we only destroy objects with an even object ID, so we are leaking 10 objects here, on purpose in order to display how this technique works.
How to run the application in dfSplat
First copy the program above and save it as "LeakyObjects.src" in a workspace such as the Order Entry one and add the program to the Studio.
Compile the program.
Next up we are going to run this little program with dfSplat.
Start dfSplat, then from the toolbar menu select the "Start Debug" button. 
This will open a "File Open" dialog and you can navigate to the program's folder of your workspace and select the LeakyObjects.exe application.
Now the program will run in the dfSplat debugger and the input from the last line of the program will popup.
Set the breakpoints
Click back on dfSplat and from the toolbar select "Open Source File", in the "File Open" dialog you get now, navigate to the AppSrc folder of your workspace and select "LeakyObjects.src" and click on the "Open" button.
The source file now shows in the edit window.
We're going to set a few breakpoints to help us.
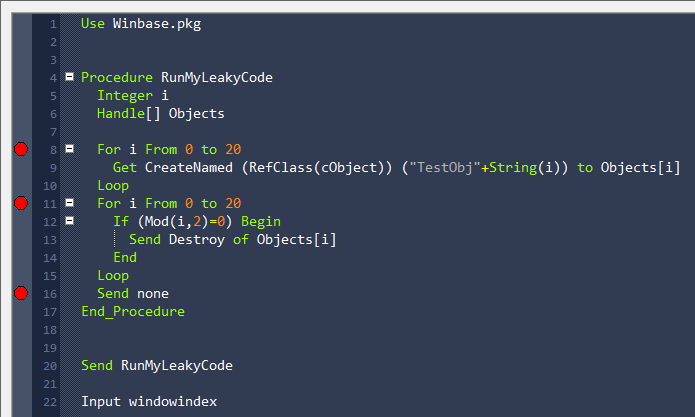
In order to set a breakpoint, click on the left margin and it will set the breakpoint (pretty much as to how it works in the Studio)
Set the breakpoints like this.
Debug for leaky objects
Click the Restart Debug button from the toolbar.
Your program will stop at the first breakpoint.
Let's have a look at all the objects that are currently in your program.
From the Tools menu, select "Object Inspector", you'll see the following dialog:
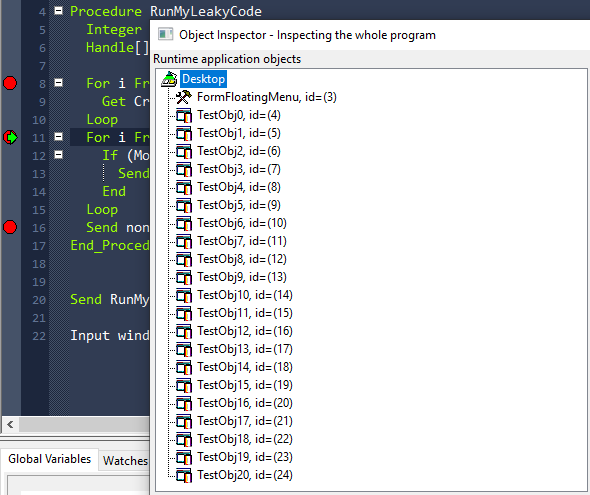
At this stage we only have a FormFloatingMenu object that is defined somewhere in the Winbase.pkg file that we are pulling in.
Close the Object Inspector and run the program (F5) again, we are now at the 2nd breakpoint. Open the Object Inspector again.
As you can see now, our 21 test objects have been created.
So far, not all that exciting.
Close the Object Inspector again and continue running the program (F5) so that we are at the 3rd breakpoint.
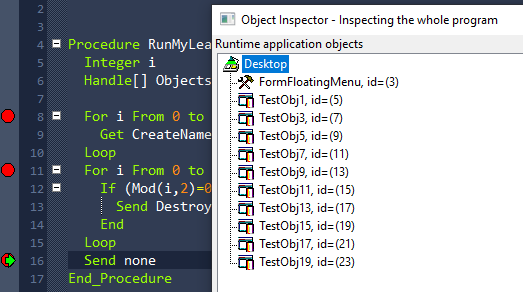
Re-open the Object Inspector:
Here you can see one of the reasons on WHY the object inspector is an interesting tool to have.
The objects that got destroyed are no longer listed, but the ones we "forgot" to destroy are still visible.
In other words, we now have an easy way to make it visible if your code did correctly destroy all the objects it was supposed to destroy!
Final notes
- Beware that you use the Object Inspector and not the Panel Inspector as the latter one is not suitable for this task. The Object Inspector will enumerate ALL objects in your application and tests which of those objects actually exist or not. The Panel Inspector will only query the objects for the current panel and if objects are created dynamically, it won't actually show them! The Panel Inspector was created to give you much faster access to your current view or panel, but it does that at the cost of not enumerating every object (hence why it is faster)
- If you want to test your code to see if it does correctly destroy all the dynamic objects it creates then it is most likely best to create a small temporary program for that. Obviously you can debug your full program, but the object inspector might be very slow to process every single object in your program on opening each time.


